- Agritech
- Durian Farming
- Farm Management
- Precision Agriculture
Mapping the Future of Durian Farming: Solving Geographic and Disease Challenges with Heatmaps
Discover how advanced farm mapping and heatmap overlays are helping durian farmers combat site-specific issues, manage diseases, and optimize yield through precision agriculture.
By Durian Solutions Team
4 min read
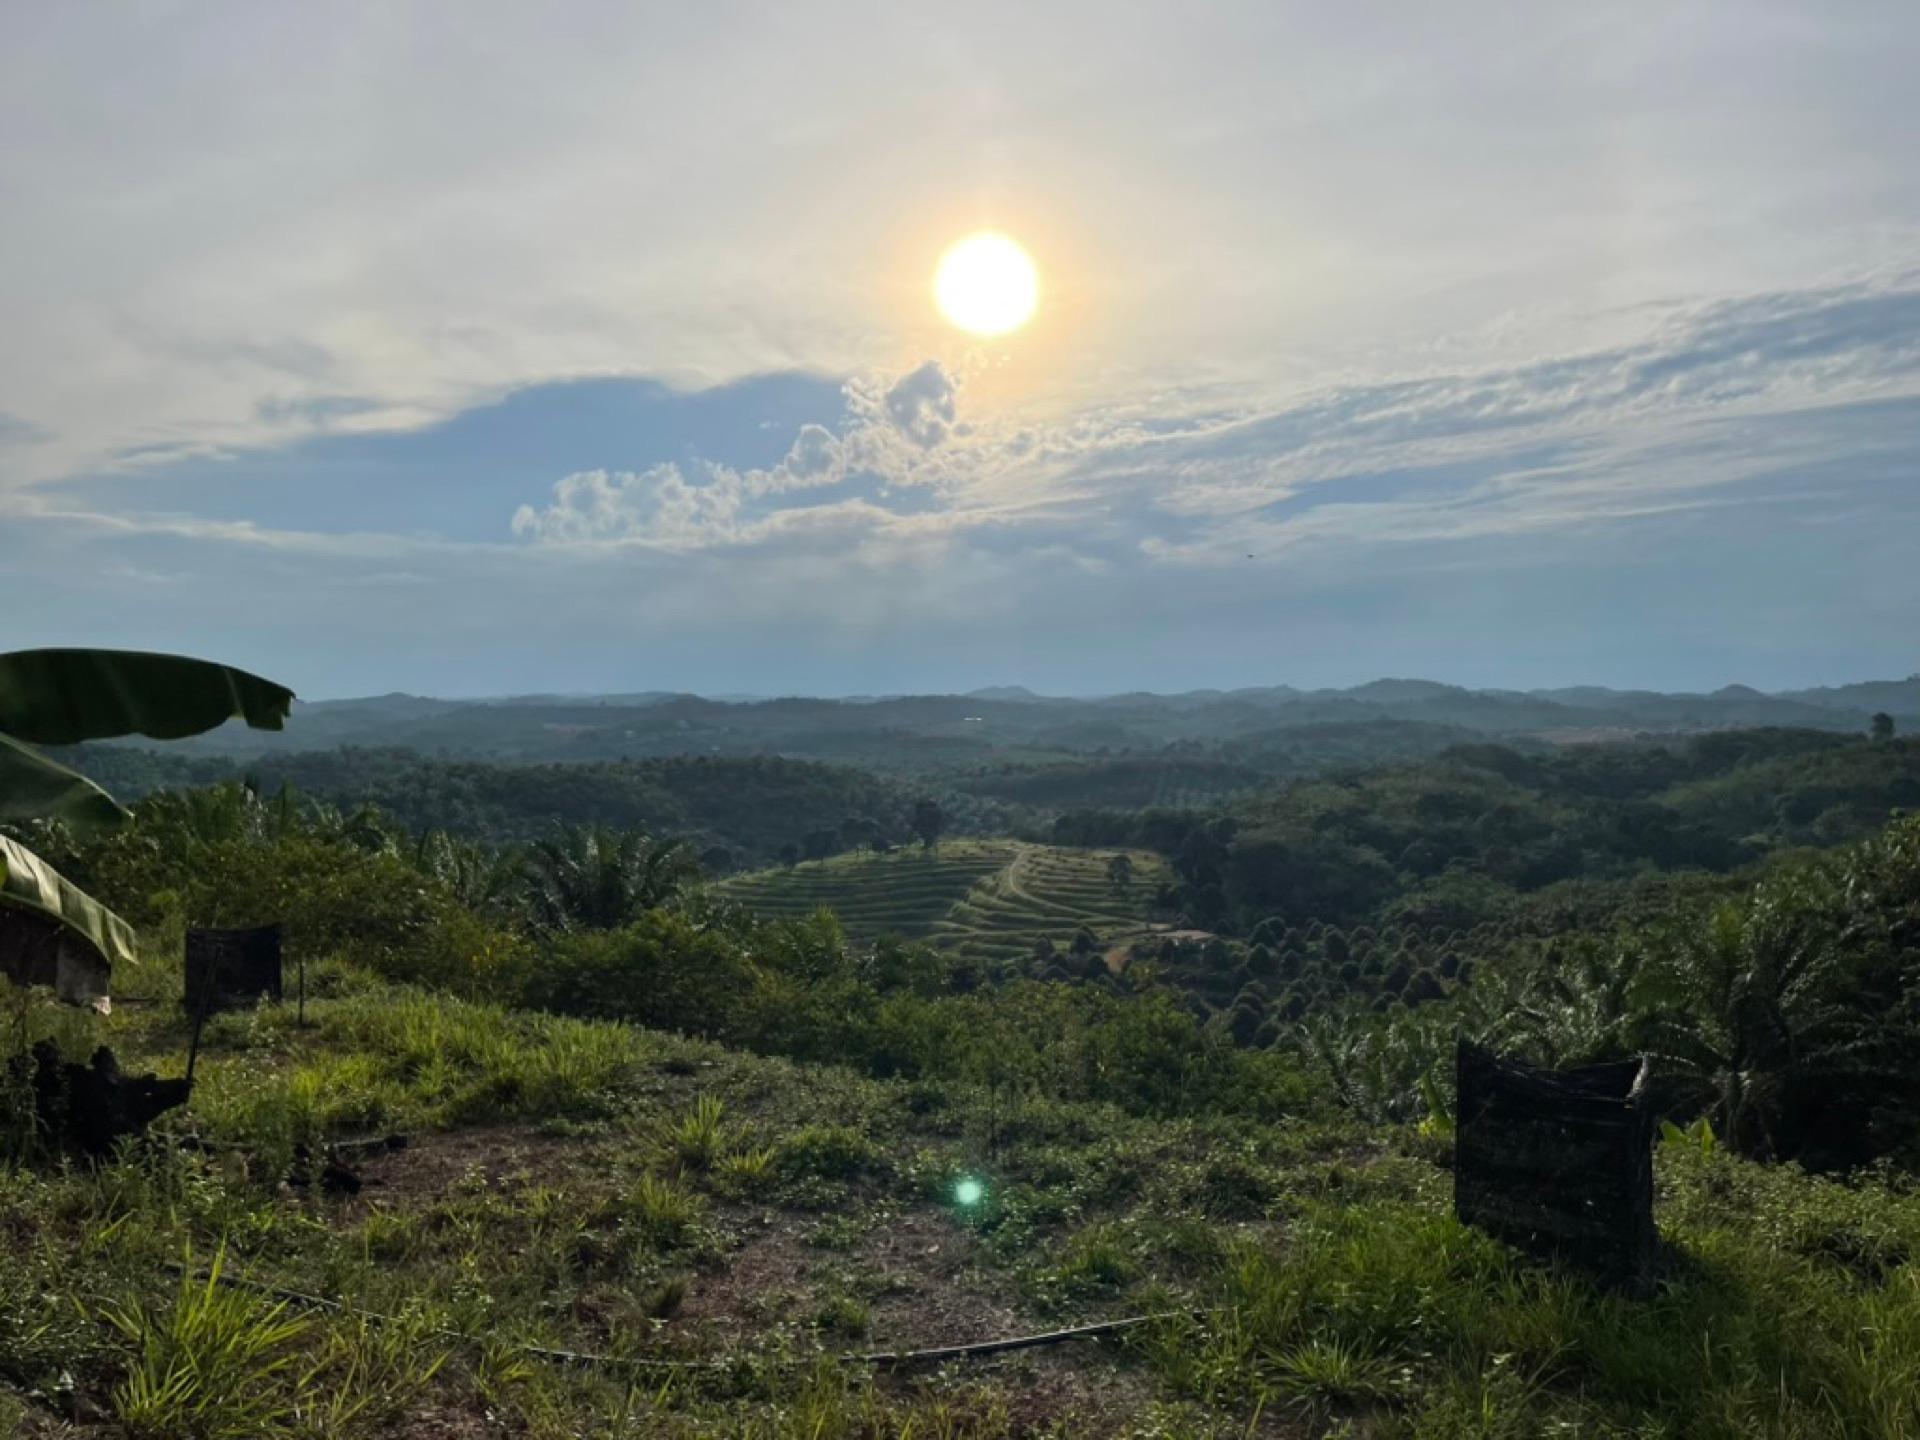
Cultivating premium durian varieties like Musang King and Black Thorn is an art that requires perfect harmony between climate, soil, and constant vigilance. However, even the most experienced farmers face unpredictable challenges dictated by the specific geography of their orchards.
From hidden damp zones breeding deadly fungi to wildlife treating the canopy like a buffet, managing a large-scale durian farm often feels like fighting fires blindfolded. But what if you could take the blindfold off?
By utilizing advanced farm mapping and heatmap overlays—like the solutions available on our Durian Farm Management Platform—farmers can now visualize orchard health, isolate issues, and deploy targeted interventions. Let’s explore how mapping transforms the way we handle common durian farming bottlenecks.
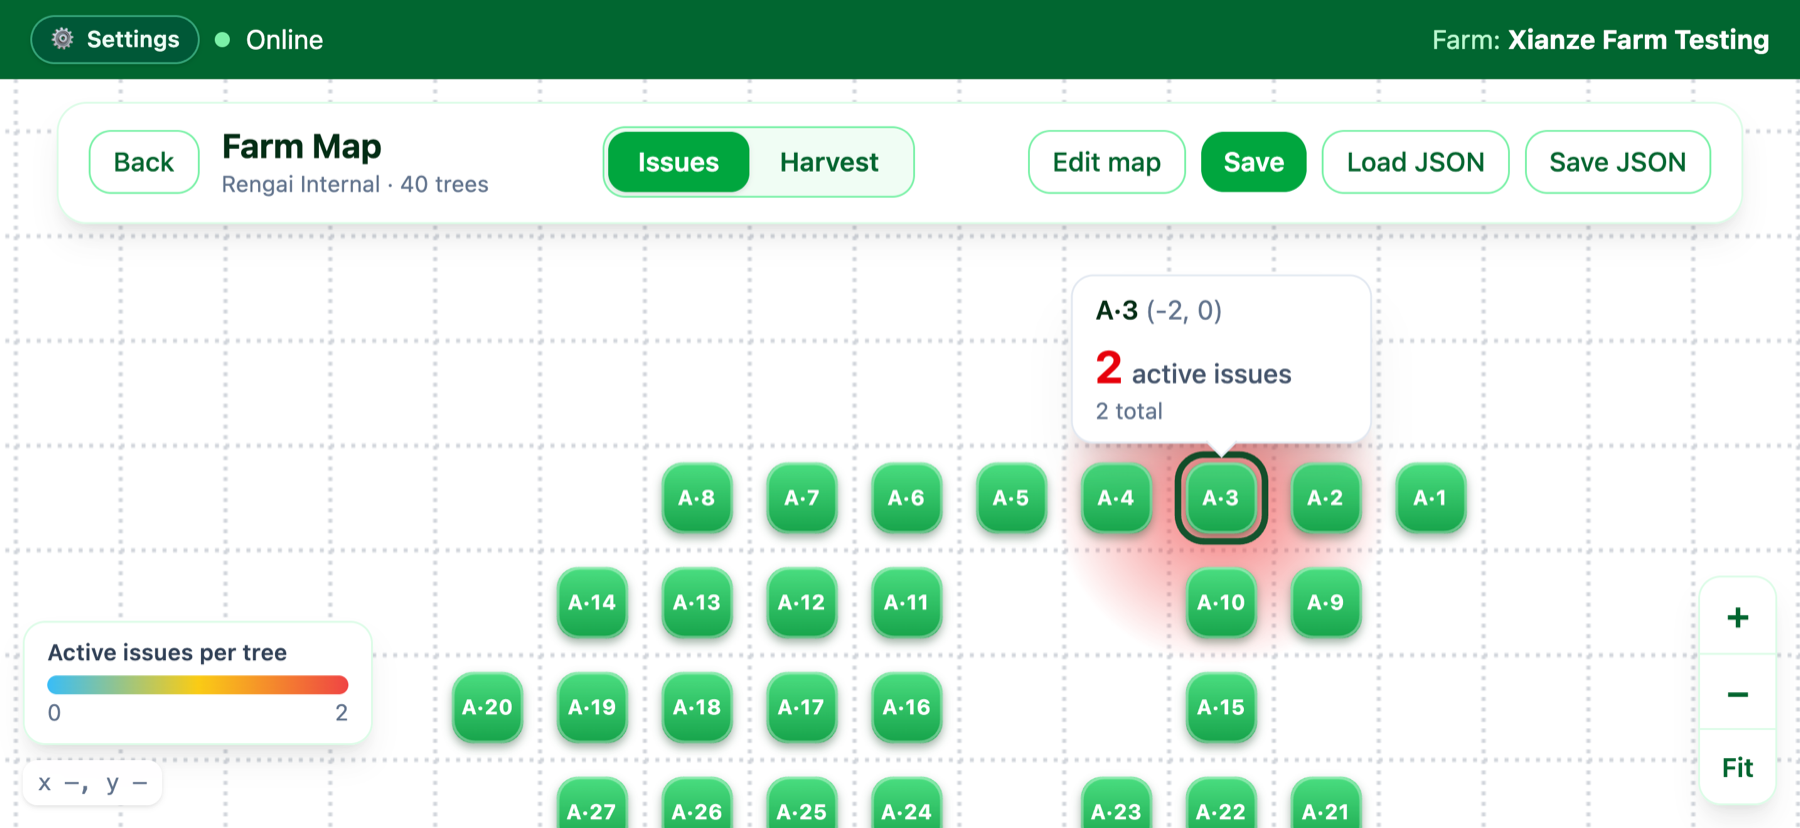 Caption: Heatmap overlays provide a bird's-eye view of orchard health, highlighting problem areas before they devastate yields.
Geographical and Site-Specific Bottlenecks
Durian trees are famously sensitive to their environment. A slight variation in terrain across a 50-acre farm can lead to drastically different microclimates, requiring entirely different management strategies.
1. Regional Dampness and Poor Drainage
Durian trees despise "wet feet." Topographical dips and regional dampness can lead to waterlogging, depriving roots of oxygen and causing a severe drop in yield. Worse, damp soil is the perfect breeding ground for destructive water molds.
The Map Solution: Instead of walking the entire farm after heavy rain, farmers can use yield and soil moisture heatmaps to instantly identify underperforming, waterlogged zones. By mapping these localized damp spots, you can efficiently plan targeted earthworks, such as digging trench drains or modifying the terracing, exactly where they are needed.
2. Terrain-Induced Sunlight Deficits
Sunlight is the engine of fruit production. In hilly terrains, certain slopes may fall into deep shadows for large portions of the day, drastically reducing photosynthesis and flower development.
The Map Solution: When historical harvest data is overlaid on a topographical map, patterns emerge. If a cluster of trees on a specific slope consistently underperforms despite good soil, it's often a sunlight issue. Maps allow farm managers to design zone-specific pruning strategies. Trees in low-light zones can be aggressively pruned to open their canopies, maximizing what little sunlight they receive without wasting labor on trees that already enjoy full sun.
3. Wildlife Intrusion Hotspots
Monkeys, squirrels, and wild boars can devastate a season's crop in days. Often, farmers only discover the damage when they find cracked, half-eaten premium fruits on the ground.
The Map Solution: By logging crop destruction incidents into a farm management app, a "damage heatmap" is generated. Animals rarely enter an orchard randomly; they follow established trails from neighboring jungles. A heatmap reveals these exact entry vectors. Once identified, farmers can deploy highly localized countermeasures:
- Setting up targeted smoke generators or automated deterrents at the specific breach points.
- Strategically cutting down surrounding jungle trees that act as "bridges" into the durian canopy.
- Deploying focused trapping or netting only in the high-risk red zones, saving immense capital compared to netting the entire farm.
Combating Common Durian Diseases with Precision
Beyond geography, disease management is the highest ongoing cost for durian farmers. Blanket spraying an entire farm is expensive, ecologically damaging, and highly inefficient.
Phytophthora Palmivora (Stem Canker and Root Rot)
Phytophthora is the durian farmer's worst nightmare. It causes stem cankers that bleed dark sap, eventually girdling and killing the tree. Because it is a water mold, it spreads rapidly downhill during the rainy season.
How Heatmaps Help: By logging early signs of Canker into the map, farmers can track the spread of the disease visually. If a cluster of infections appears on a slope, farmers can proactively treat the trees directly downhill before they show symptoms, effectively creating a chemical firebreak.
Leaf Blight (Rhizoctonia)
Causing leaves to shrivel and drop, leaf blight reduces the tree's energy reserves, directly impacting fruit size. It thrives in dense, overly humid canopies.
How Heatmaps Help: Heatmaps displaying high concentrations of leaf blight correlate directly with areas of poor air circulation. Farmers can use this spatial data to prioritize canopy thinning and airflow management in those specific micro-zones, breaking the humidity cycle that feeds the fungus.
Caption: Watch how our platform tracks disease progression over time, allowing for rapid, localized intervention.
The Bottom Line: From Reactive to Proactive
For decades, durian farming has been a reactive industry—treating a sick tree after it shows symptoms, or digging a drain after the roots have rotted.
With interactive farm maps and heatmap overlays, farm management becomes proactive. You are no longer just looking at individual trees; you are looking at the living, breathing data of your entire orchard ecosystem. By understanding exactly where and why issues are happening, you can drastically reduce labor and chemical costs, protect your premium fruits, and secure your harvest.
Ready to see your farm from a new perspective? Explore the mapping capabilities at Durian Farm Solutions and start turning your farm data into actionable profit.
Want this on your farm?
We'll walk you through the app with your own zones and trees.